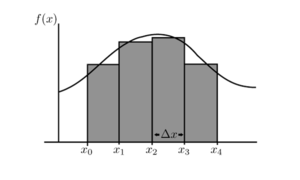
Let's have a function f positive in an interval [x₀, x₄] and find the area under the curve of f between x₀ and x₄. The method consists of approximating the value of an area by dividing the area under the curve of (f) by a certain number of rectangles. Let's choose to divide the area under the curve into 4 rectangles of equal width Δx (delta x)

Let's name the area S(4). Then:
Let's divide S by 5 rectangles we have:
.
The following simulation represents numerical values of the area S for a corresponding number of rectangles.
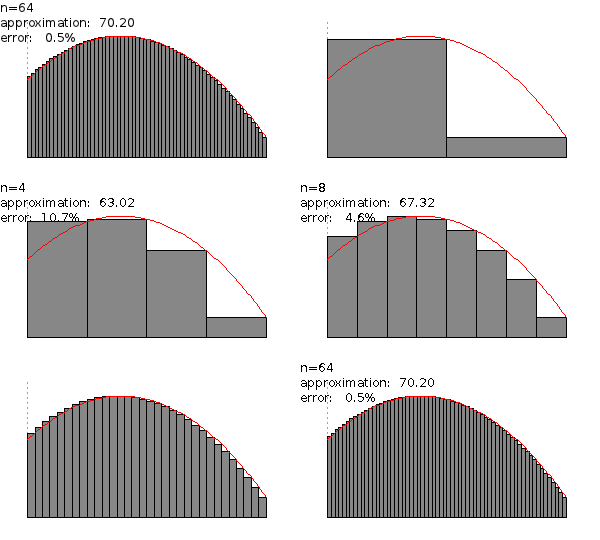
Each time we divide the area by a greater number the corresponding area approximates a greater number which is a better approximation. This fact is illustrated in the following figure:

In the figure above for n = 1 the approximated area is 14.62. For n = 2 the approximation is 51.20. For n = 4 the approximation is 63.02. For n = 8, the approximation 67.32. For n = 16 the approximation is 69.07. For n = 32 the approximation is 69.84. For n = 64 the approximation is 70.20.
If we divide the area by n rectangles the area S(n) can be calculated by:
S(n) can be written as S(n) = Σ f(xi)𝚫x with i varying from 1 to n or:
As n comes to an extremely greater number the area approximates a greater number. The approximation becomes better and better and comes close to a greater number. This greatest number is the best approximation for the area of the rectangle. It is the limit of all the approximations when the number of rectangles n becomes extremely high. This limit is the limit of the function S(n). We write:
This value represents the integral of the function f between x0 and x1
We write:


No comments:
Post a Comment