Saturday, October 28, 2023

Parameterization of a curve

 Objective:

Transform the function of a curve into parametric equations.

Parameterization of a curve

In the previous lesson we learn how to eliminate the parameter in the parametric equations of a curve. In this post we do the reverse meaning transforming a function of a curve into parametric equations.

Example

Find two different pairs of parametric equations to represent the graph of y = 2x² - 3

Solution

One of the easiest way to do this is to write x(t) = t and substitute x in the function. The result is y = 2 t²-3.

The first set of pair of parametric equations is x(t) = t y = 2t²-3

Since there is no restriction on the domain of the function, we can have a variety of expressions of x in function of t and then substitute x in the function.

For the second pair of equations let's choose x(t) = 3t-2

Let's substitute x in the function:


Therefore a second parameterization of the function is represented by:


Practice

Find two different sets of parametric equations to represent the graph of y = x² + 2x


Friday, October 20, 2023

Converting the parametric equations of a curve into an explicit form

 Objective: Convert the parametric equations of a curve into the form y = f(x)

Conversion of the parametric equations of a curve into an explicit form

Usually we are more accustomed in graphing the curve of a function represented explicitly meaning representing a relation between y and x. It is possible to convert the parametric equations of a curve into its explicit form.  The process is very simple. It consist in finding the expression of t in one of the parametric equations and then substituting it in the other. 

Examples:


a) let's solve example a)

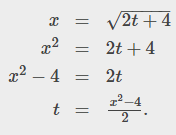
Let's find t in the first equation. We can also find it in the second equation.


Let's substitute t in the second equation:


This is the equation of a parabola opening upward. The limits of the parameter lead to a domain restriction of the function.

The interval for t is mentioned in the problem: -6≤t≤-2

Let's substitute t = -6 in the expression of x, we find x = 0. Let's substitute t = -2 in the expression of x, we find x = 4. The domain of the function is D = [0,4].


b) I am not going to solve completely the example 2. I'll give some steps. 

Instead of solving for t find sint and cost in both equations. Substitute sint and cost in the identity sin²t + cos²t = 1. The equation found is the equation of an ellipse centered in the origin.

Practice

Eliminate the parameter for the plane curve defined by the following parametric equations and describe the resulting graph:

x(t) = 2 + 3/t  y(t) = t-1  2≤t≤6


Tuesday, October 10, 2023

What are parametric equations and how to graph their curve

 Objectives:

1. Define parametric equations

2. Plot their curve

Considerations

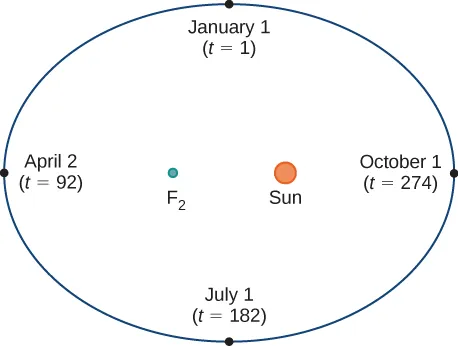
Let's consider the orbit of the earth around the sun. 


The earth revolves around the sun in 365.25 days. In this case, we consider 365 days. Each number in the figure represents the position of the earth in respect to the sun. The letter t represents the number of the Day. For example t = 1 means Day 1 that corresponds to January 1st, t = 274 means Day 274 and corresponds to October 1, and so on. According to Kepler's laws of planetary movement, the orbit of the earth around the sun is an ellipse with the earth at one of the foci.

Let's superimpose the ellipse on a system of coordinates (x,y):


Now that the orbit is placed in a system of coordinates, each point is defined as a pair (x,y) where x and y are functions of t. Each point of the ellipse is defined by its coordinates (x(t), y(t)). This pair defines the parametric equations of the ellipse where t is the parameter.


Definition

If x and y are continuous functions of t on an interval I, then the equations x = x(t) and y = y(t) are called parametric equations and t is called the parameter. The set of points (x,y) obtained as t varies over the interval I is called the graph of the parametric equations. The graph of parametric equations is called a parametric curve or plane curve, and is denoted by C

Notice in this definition that x and y are used in two ways. The first is as functions of the independent variable t. As t varies over the interval I, the functions x(t) and y(t) generate a set of pairs (x,y). This set of ordered pairs generates the graph of the parametric equations. In this second usage, to designate the ordered pairs, x and y are variables. It is important to distinguish the variables x and y from the functions x(t) and y(t). 


Examples


Solution


Plotting the points on the second and third columns allows to draw the graph of the parametric equations. The arrows on the graph indicate the orientation of the graph that is the direction of a point on the graph as t varies from -3 to 2.


Example c.

In this case, use multiples of π/6 for t and create another table of values:

t          x(t)                  y(t)              t             x(t)                     y(t)

0          4                      0                 7π/6        -2⎷3 ≃ -3.5       2

π/6       2⎷3≃ 3.5        2                4π/3           -2                   -2⎷ 3≃ -3.5

π/3        2                  2⎷3≃ 3.5    3π/2            0                     -4

π/2        0                   4                 5π/3            2                      -2⎷≃ -3.5

2π/3       -2                 2⎷ ≃ 3.5     11π/6         2⎷≃ 3.5            2

5π/6        2⎷3≃ -3.5      2              2π               4                       0

π              -4                 0                  


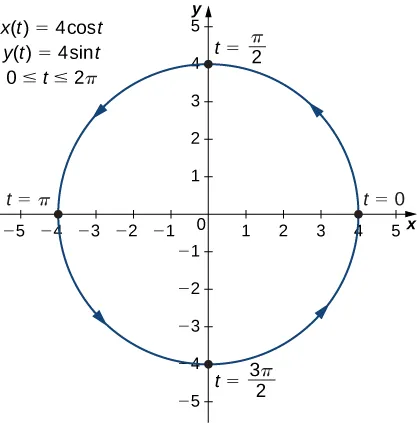
The graph of this plane curve appears in the following graph:


This is the graph of a circle with radius 4 centered at the origin, with a counterclockwise orientation. The starting point and the ending point of the curve both have coordinates (4,0).

Practice. Solve example b)