Saturday, February 24, 2024

Arc length in polar curves

Goal : find a formula for the arc length of a curve in polar coordinates

Arc length of a curve in polar coordinates

To find the formula for the arc length of a curve in polar coordinates, let's start from the formula of the arc length of a parametrized curve (x(t), y(t)) for a≤ t ≤b  in rectangular coordinates.


In polar coordinates the curve is defined by r = f(θ) and we also have:
x = rcosθ = f(θ)cosθ and y = rsinθ =f(θ)sinθ . Let's calculate dx/dθ and dy/dθ:


Let's replace dt by dθ and a and b by ɑ and β, which define the limits of integration of the curve in polar coordinates, in the formula for the arc length above:


This leads to the following theorem:

Theorem


Friday, February 23, 2024

Area between two polar curves

 Goal: find the area between 2 polar curves

Area between 2 polar curves

The procedure to find the area  between 2 polar curves is similar to that of the area of 2 curves in the system of coordinates in the cartesian plane, We find the points of intersection between the 2 curves and identify the functions that define the outer curve and the inner curve respectively.

Example

Find the area outside of the cardioid r = 2 + 2 sinθ and inside the circle r = 6 sinθ

Solution

 First, draw a graph containing both curves


To find the limits of integration, let's find the points of intersection by setting the 2 functions equal to each other and solving for θ


The solutions of this equation are θ = ℼ/6 and θ = 5ℼ/6, which are the limits of integration. The graph of the circle, in red.. is the outer curve. The graph of the cardioid, in blue, is the inner curve. To find the area between the 2 curves, let's subtract the area of the cardioid from that of the circle.


Practice

Find the area inside the circle r = 4 cosθ and outside the circle r = 2.

Tuesday, February 20, 2024

Area of a region bounded by a polar curve (continued)

 In the previous post, we set  the formula to find the area of a region bounded by a polar curve. Let's do an application.

Example. Find the area of one petal of the rose defined by the equation r = 3sin (2θ)

Solution

Here is the graph of the of the petal of the rose


The first petal of the rose is traced out from the polar coordinates (0, 0) and (0, 𝝅/2). To find the area inside the petal, let's use the formula of the area of the region bounded by a polar curve. In this formula we substitute 𝛼 by 0 and 𝛽 by 𝝅/2. 


To evaluate this integral, let's use the formula sin²𝛂 = 1 - cos(2𝛂) with 𝛂 = 2𝜃

Practice

Find the area inside the cardioid defined by the equation r = 1-cos𝜃

Saturday, February 17, 2024

Areas of regions bounded by polar curves

 To find the area of a region bounded by a curve in rectangular coordinates, we use the Riemann sum to approximate the area under the curve by using rectangles. In polar coordinates, we are going to use the Riemann sum also to find the area bounded by a curve but instead of using rectangles we will use sectors of a circle. Let's consider the curve defined by the function r = f(θ) where α ≤ θ ⩽ 𝛃. Our goal is to find the area bounded by the curve and the 2 radial lines θ = α and θ =𝛃. 


Let's start by dividing the area into sectors of equal width. We name the width Δθ and it's calculated by using this formula: Δθ = 𝛃 - α/n. Let's find the area of the sectors. They have equal area since their measurement is equal. The area of each sector is used to approximate the area between line segments. We sum the area of the sectors to approximate the total area. Let's find the formula for the area of a sector.

The area of a circle is given by A = 𝝅r². The length of a circle is 360 degrees or 2π. The surface for one radian is A = 𝝅r²/2π = r²/2. The area for a sector of Δθ radians is A =  Δθ r²/2. This represents the area of any sector. Let's call it Aᵢ and substitute r by f(θ). Aᵢ = 1/2 [f(θ)]².

Let's add the areas of all the sectors to approximate the area bounded by the polar curve and the radial lines :


Let's divide the sector in as many subintervals as possible. At some point we approach infinity. The area of the sector is then given by:

Theorem                                                                                                                                                   
                                                                                                                                                 
Suppose f is continuous and non negative on the interval  α ≤ θ ⩽ 𝛃 with 0 ≤ α - 𝛃 ≤ 2𝝅. The area of the region bounded by the graph r = f(θ) between the radial lines θ = α and θ = 𝛃   is:


Monday, February 12, 2024

Transforming polar equations into rectangular coordinates

 Transforming polar equations into rectangular coordinates leads to find a relation between x and y. To do so, we use the formulas that allow to convert points between coordinates.

Example

Rewrite each of the following equations into rectangular coordinates and identify the graph.

a. θ = π/3

b.  r = 3

c. r = 6cosθ-8sinθ

Solution

a,Let's take the tangent of of both sides:

tanӨ = tan𝝅/3 = ⎷3

Let's substitute tanӨ by y/x:

y/x = ⎷3   y = x⎷3. This is the equation of a straight line passing through the origin and of slope ⎷3. In general any polar equation of the form  θ = K represents a straight line passing through the pole and with slope tanK.

b. Let's use the equation x² + y² = r². Let's substitute r by 3:  x² + y² = 9. This is the equation of a circle centered at the origin. In general, any polar equation of the form r = k where k is a positive constant represents a circle centered at the origin and with radius k.

c.  Let's multiply both sides by r:

r² = 6rcosθ-8rsinθ.

Let's substitute rcosθ by x and rsinθ by y.

r² = 6x - 8y.

Let's use the equation x² + y² = r² and substitute r² :

x² + y² = 6x - 8y

x² -  6x + y² + 8y = 0

x² -  6x +9-9 + y² + 8y + 16-16 = 0

(x² -  6x +9) +(y² + 8y + 16) -25= 0

(x-3)² + (y + 4)² = 25

This the equation of a circle centered at the point (3, -4) with radius r = 5.

Practice

Rewrite the equation r = secθtanθ in rectangular coordinates and identify its graph.


Saturday, February 10, 2024

Polar curves

 Goal: graph a curve in the polar coordinate system

Polar curve

The same way we graph a function y = f(x) in the cartesian plane, we can generate a curve for the function r = f(θ) in the polar coordinate system. We start by creating a list of values for the independent values θ. Then we create another list for the dependent variable r. This process generates a list of ordered pairs that can be plotted in the polar coordinate system.

Problem-solving strategy

1. Create a table with 2 columns: one for θ and the other for r.

2. Create a list of values for θ

3. Calculate the corresponding values r for each value of θ.

4. Plot each pair (r,θ) in the coordinate plane

5. Connect the points and look for a pattern.

Example

Graph the curve defined by the function r = 4 sinθ. Identify the curve and rewrite the equation in rectangular coordinates.

Solution

The function is a multiple of the sine function. Since sine is periodic the given function is periodic. The period of sine is 2ℼ. The period of the function is 2ℼ.. We choose the values of θ between 0 and 2ℼ. Here is the table of values:

Here is the graph of the function:                                                                                                            


 Rewrite the given equation in rectangular coordinates means writing in function of x and y. To do so, let's use the equation x² + y² = r². Let's multiply the equation r = 4sinθ by r, This gives r² = 4rsinθ. We know that y = 4sinθ. Therefore we have r² = 4y. . Let's substitute r² in the initial equation. We have 
x² + y² = 4y. Let's put it in standard form.   


This is the equation of a circle of radius 2 and center (0,2) in the rectangular coordinate system'

Practice                                                                                                                                                     


Friday, February 9, 2024

Plotting points in the polar plane

 Goal: plot points in the polar plane

Plotting a point in the polar plane

The polar representation of a point is not unique. For example, the polar coordinates (2, π/3) and (2, 7π/3) both represent the point (1, ⎷3). Also the value of r can be negative. Aa a result the polar coordinate (-2. 2𝛑/3) represents also the point (1, ⎷3) in the cartesian plane as demonstrated here:


Every point in the plane has an infinite number of representations in polar coordinates. The polar representation of a point in the plane has a visual interpretation. First, we have r that represents the distance of the segment that joins the origin to the point. Then Ө is the angle made of that segment and the positive direction of the x-axis. Positive angles are measured in counterclockwise direction and negative angles are measured in clockwise direction. Here is a representation of the polar coordinate system.


The  positive x-axis in the cartesian plane is the polar axis, The origin of the coordinate system is the pole and corresponds to r = 0. The innermost circle of the figure above contains all the points with r = 1 meaning all the points of which the distance from the pole is 1. Then the figure progresses from r = 2 and so on. To plot a point in the coordinate system start from the angle. If the angle is positive, move in counterclockwise direction from the polar axis. If the angle is negative move in clockwise direction of the polar axis. If the value of r is positive consider the ray that is terminal to the angle. If r is negative, consider the opposite ray terminal to the angle.                                                                                       
 
Example                                                                                                                                                 
                                                                                                                                                  
Plot each of the following points in the polar plane                                                                                  
 

                                                                              .
                                                                                                                                                   
Solution                                                                                                                                               


Practice                                                                                                                                                   


Friday, February 2, 2024

What are Polar Coordinates? How to convert points between rectangular and polar coordinates?

 Goals:

1) Define polar coordinates

2) Convert points between rectangular and polar coordinates

Polar Coordinates

Definition

The rectangular coordinate system provides a way to map points to ordered pairs. The polar coordinate system provides an alternative method for mapping points to ordered pairs.

Let's consider the following figure:


The point P has has (x,y) for coordinates in the rectangular coordinate system. The line segment that joins the origin to the point P measures the distance between these two points. This distance is designated by the letter r.. The angle between this segment and the positive part of the x-axis is designated by Ө. Now the point P can not only be referred by its cartesian coordinate x and y but by r and Ө. These 2 letters represent the polar coordinates of the point P.


Every point (x,y) in the cartesian coordinate system can be represented in the polar coordinate system by an ordered pair (r, Ө), The first coordinate is called radial coordinate. The second coordinate is called angular coordinate.

Converting points between coordinate systems

Theorem

Given a point P in the plane represented by its cartesian coordinates (x,y) and its polar coordinates (r,θ), the following relations hold true:


These formulas can be used to convert from cartesian coordinates to polar coordinates and vice-versa.,

Examples 

Converting between rectangular and polar coordinates

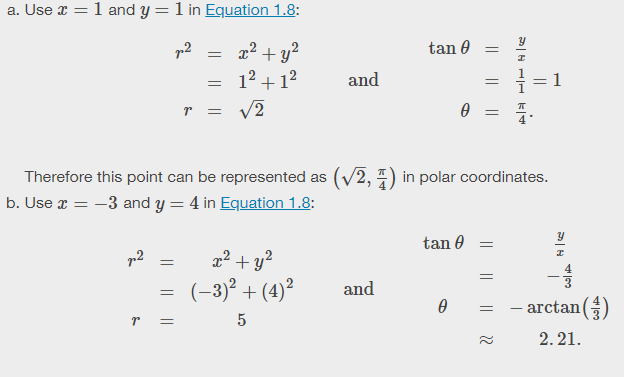
1. Convert each of the following points into the polar coordinate system:


2. Convert each of the following points into the rectangular coordinate system:


Solution

1.


2.


Practice