Objectives:
1. Define parametric equations
2. Plot their curve
Considerations
Let's consider the orbit of the earth around the sun.
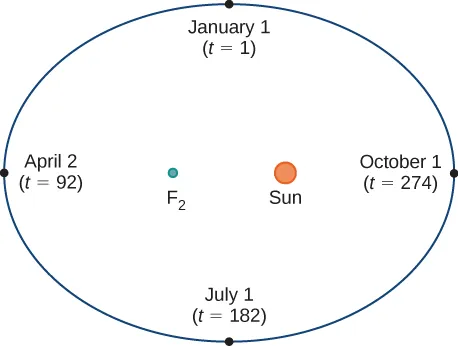
Let's superimpose the ellipse on a system of coordinates (x,y):

Now that the orbit is placed in a system of coordinates, each point is defined as a pair (x,y) where x and y are functions of t. Each point of the ellipse is defined by its coordinates (x(t), y(t)). This pair defines the parametric equations of the ellipse where t is the parameter.
If x and y are continuous functions of t on an interval I, then the equations x = x(t) and y = y(t) are called parametric equations and t is called the parameter. The set of points (x,y) obtained as t varies over the interval I is called the graph of the parametric equations. The graph of parametric equations is called a parametric curve or plane curve, and is denoted by C
Examples

Solution

Plotting the points on the second and third columns allows to draw the graph of the parametric equations. The arrows on the graph indicate the orientation of the graph that is the direction of a point on the graph as t varies from -3 to 2.

Example c.
Notice in this definition that x and y are used in two ways. The first is as functions of the independent variable t. As t varies over the interval I, the functions x(t) and y(t) generate a set of pairs (x,y). This set of ordered pairs generates the graph of the parametric equations. In this second usage, to designate the ordered pairs, x and y are variables. It is important to distinguish the variables x and y from the functions x(t) and y(t).
Example c.
In this case, use multiples of π/6 for t and create another table of values:
t x(t) y(t) t x(t) y(t)
0 4 0 7π/6 -2⎷3 ≃ -3.5 2
π/6 2⎷3≃ 3.5 2 4π/3 -2 -2⎷ 3≃ -3.5
π/3 2 2⎷3≃ 3.5 3π/2 0 -4
π/2 0 4 5π/3 2 -2⎷≃ -3.5
2π/3 -2 2⎷ ≃ 3.5 11π/6 2⎷≃ 3.5 2
5π/6 2⎷3≃ -3.5 2 2π 4 0
π -4 0
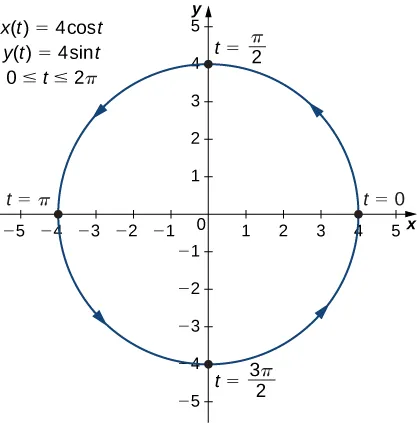
This is the graph of a circle with radius 4 centered at the origin, with a counterclockwise orientation. The starting point and the ending point of the curve both have coordinates (4,0).
The graph of this plane curve appears in the following graph:
Practice. Solve example b)
No comments:
Post a Comment